
Dear Sports Fan,
What does games back mean in sports standings? And how can a team be a half game back?
Thanks,
Greg
— — —
Dear Greg,
That’s a great question! Games back can be a confusing concept. Games back is a metric that attempts to show how far behind a team is, controlled for the number of games they have played. A team can be a certain number of games back from another team or from a position in the standings. In both scenarios, the target is moving. Games back is a concept that confuses many people who follow sports religiously so showing an understanding of this concept gives you a simple way of flashing your sports expertise, even among sports fans!
On the first day of a season, Team A beats Team B. Team A’s record is now 1 win and 0 losses. Team B’s is 0 wins and 1 loss. Team B is behind Team A in number of wins and in games back. So far those are the same thing. On the second day of the season, Team A plays Team C and wins again. Team B doesn’t have a game. Now Team A’s record is 2 wins and 0 losses and Team B’s record is still 0 wins and 1 loss. Team B now has two fewer wins in the standings but they are not two games back of Team A. This is because Team B has played one fewer game and the games back metric tries to control for that. Games back controls for unplayed games by counting them as one half of a win. You may hear these unplayed games called games in hand, so just remember that while a game in hand may be worth two in the bush, it’s only worth half a game in of games back. Team B is said to be 1.5 games back from Team A.
As the season goes on, this metric becomes a little harder to calculate in our heads like we just did for Team B and Team A. Wikipedia has a simple calculation for games back and though I don’t exactly understand why it works, I believe it works. It’s Games Back = ((Team A’s wins – Team A’s losses) – (Team B’s wins – Team B’s losses))/2. In our scenario, that’s ((2-0)-(0-1)/2 which simplifies to 3/2 or 1.5 games back.
In addition to calculating how many games back Team B is from Team A, it’s also common to express games back relative to a position in the standings. Two common ones are games back (or behind or out of) first place or the last team that would qualify for the playoffs. In this case, the calculation is the same, it’s just done by comparing Team B to whatever team represents that place in the standings. If today Team A is in first place, Team B would be 1.5 games out of first place. If tomorrow Team C, D, or E[1] is in first place, the calculation would be done between their record and Team B’s record.
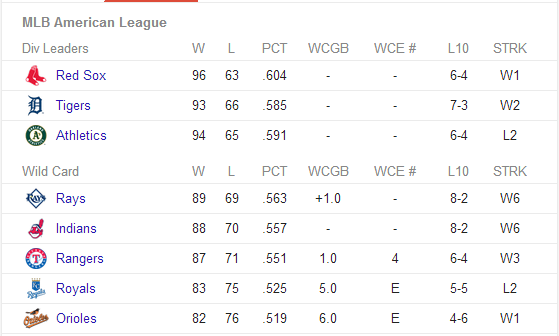
 Before we leave this topic, let’s look at some real standings as of today in Major League Baseball. The WCGB column stands for WildCard Games Back. The way baseball playoffs work is that the three division winners all make the playoffs automatically and then the next two teams with the best records make it as well. These two playoff spots for non-division winners are called Wildcards. The WCGB column is calculating the number of games back a team is from getting that second and last wildcard playoff spot.
Right now the Indians are in the last playoff spot so they are zero games back. They are the target. The Rays have played the same number of games as the Indians and have one more win and one fewer loss so they are said to be +1 games back. Don’t worry about how stupid that sounds, this means they are a game ahead. The Rangers have also played exactly the same number of games as the Indians. They have one fewer win and one more loss though, so they are 1 game behind the last playoff spot as represented currently by the Indians.
We have to go all the way down to the Mariners to find a team that is an uneven number of games back. If you add their wins and losses, you see that the Mariners have played 159 games compared to the Indians’ 158. That explains the .5 in the games back column. The Indians have 18 more wins than the Mariners but because they have a game in hand, they are given an extra .5 when calculating how far back the Mariners are compared to the Indians.
Data visualization guru Edward Tufte uses sports standings to show how much data can be packed into a simple table and remain understandable (even to dumb sports fans is the unspoken ellipses that I hear) and why making a chart for any fewer than a few hundred data points is usually not necessary. As a devotee of his, I’m happy you asked this question. Hopefully this post has made all those tables in the sports section a little easier to read!
Thanks,
Ezra Fischer
- GO TEAM E!!!↵