What does Wins Above Replacement or WAR mean in baseball?

Dear Sports Fan,

What does the stat Wins Above Replacement or WAR mean in baseball?

Thanks,
Rich

— — —

Dear Rich,

Wins Above Replacement is one of the many statistics that have either invaded or enhanced baseball over the past twenty years, depending on your perspective. It’s a single stat made up of many parts that tries to summarize the overall value of a player to the success of their team in a single number. The higher a player’s WAR number, the more they have contributed to their team’s success.

WAR is expressed as the number of wins a player’s team won thanks to their contributions as compared to what the team would have won (speculation warning) if they had been replaced by someone else. Baseball Prospectus, one of the several entities that has their own way of calculating WAR, lists Tim Keefe’s 1883 season as the best ever, during which he contributed 20.2 wins to the New York Metropolitans. If, instead of Mr. Keefe, the Metropolitans had had to scour their farm system for another right handed pitcher, this stat suggests they would have only won 34 games instead of the 54 they actually won.

Here’s the thing about WAR: because it’s intended to be an all encompassing statistic, it’s very complicated. It encompasses a lot of stuff! This is a screenshot from the Wikipedia article on WAR:

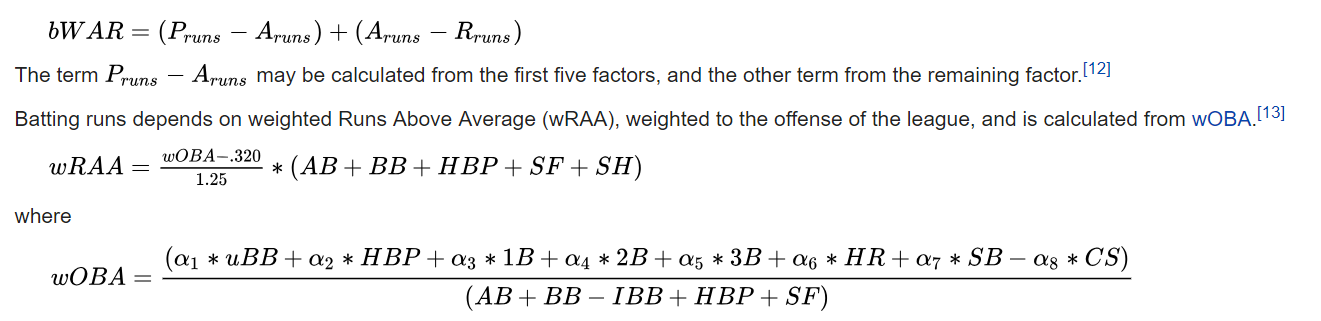
Woah! Don’t panic though. In order to understand WAR at a basic level, we need to understand two things — what elements are scored to show whether a player is doing well or poorly and what a replacement player is and how their potential contribution is defined.

What contributes to a player’s Wins Above Replacement?

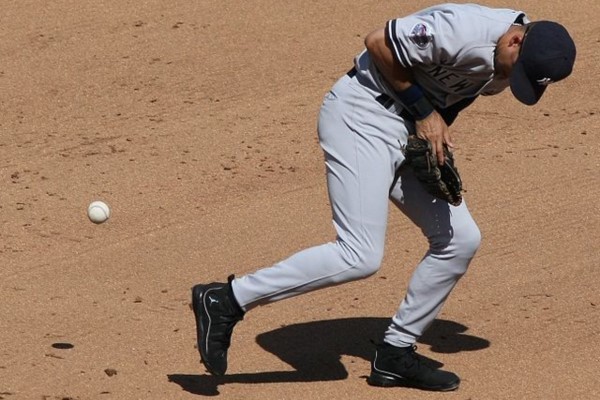
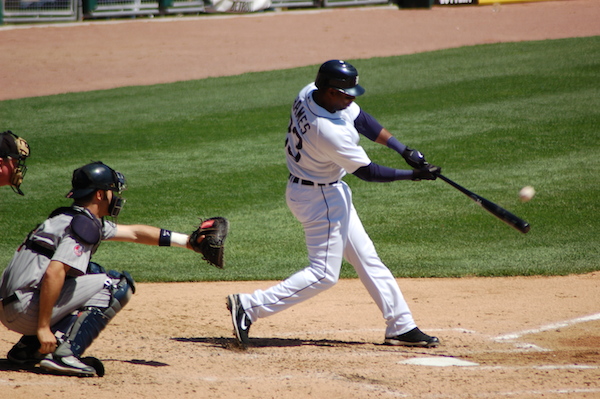
Although different groups calculate WAR using different formulas, there are some general elements that go into figuring out a player’s contributions to their team. Offensive statistics having to do with hitting and base running are used. Defensively, an everyday player’s fielding is looked at whereas all sorts of pitching statistics are available for pitchers as well as the batting statistics of opposing teams. Overarching all of this is availability – in order to contribute, you’ve got to avoid injury.

What is a replacement player and how is their contribution defined?

Here’s where WAR gets all highfaluting and counterfactual. It’s all very well to measure a player’s contribution to their team’s victories but that’s just the first letter in a three letter statistic! The AR in WAR means “above replacement.” In other words — if Old Hoss Radbourn (the second highest single-season WAR player ever) had broken his ankle before the 1884 season, how would the Providence Grays have done? This question begs another question — who would he be replaced by?

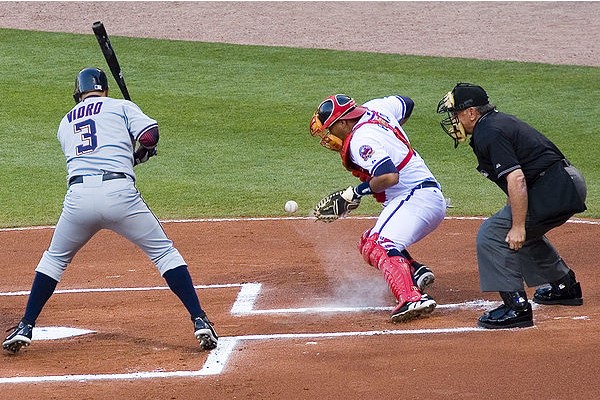
The creators of the WAR statistic believe that there is a generally available and definable level of baseball talent that we can assume would replace any player out there. Given baseball’s well established farm system, (there are 19 minor league baseball leagues with 256 teams in the Major League Baseball ecosystem) that’s probably somewhat true. A replacement-level player is defined for most WAR calculations as one who is 80% as good as the average major league baseball player. One exception to that is the catcher position, which despite (or perhaps because of) being the coolest position in the sport, has fewer players who are decent at it. For that reason, replacement-level catchers are defined as 75% of the league average catcher.


So that’s WAR or Wins Above Replacement in baseball. I find it an interesting statistic because it contains within it the terrifying truth of many professional athlete’s lives that they are eminently replaceable. It’s also sort of funny to think about extending the logic of the statistic to everyday life. “How’s the fried calamari at this place?”
“It’s great — I’d say it’s about seven YAR”
“YAR?”
“Yums Above Replacement…”

Thanks for reading,
Ezra Fischer

Does a fielder get an error in baseball if nothing bad happens?

Dear Sports Fan,

We were watching baseball yesterday and the second baseman clearly messed up when trying to field a ground ball. After dropping it, he was able to recover in time to get the runner out at first base. Would he get an error? Does a fielder get an error in baseball if nothing bad happens?

Thanks,
Sonja

— — —

Dear Sonja,

In the scenario you are describing, the fielder would not be given an error for that play. This is because, like you wrote,  “nothing bad happened.” According to the rules of MLB baseball (Rule 10.12(d)(4)) “The official scorer shall not charge an error against: any fielder when, after fumbling a ground ball or dropping a batted ball that is in flight or a thrown ball, the fielder recovers the ball in time to force out a runner at any base.”

This seems bizarre to me. I’ve always had a hard time understanding and accepting the importance of errors in baseball. They seem like a truly bizarre mixture of process, intent, and outcome. In your scenario, the fielder’s intent was good — he wanted to catch the ball and throw it to first base. His process was not good — he dropped the ball. The outcome, however, was fine — he got the runner out. So, no error. He essentially lucked out. 

If, however, the the fielder had done the exact same thing but he was up against a faster runner who beat the throw to first base, he would have been assigned an error. No difference in process, just in outcome. Of course, outcome matters — it’s what leads to a win or a loss, which is the whole point. On the other hand, baseball already has outcome stats – if a runner makes it to first base, it’s called a single! The error seems like it’s supposed to be a different kind of stat; one that shows who messed up but in this case, it blends outcome and process.

Thanks for reading,
Ezra Fischer

What is a hockey assist?

Dear Sports Fan,

I was playing basketball the other day and one of my teammates complimented me on a “nice hockey assist.” I know that an assist is the pass right before someone makes a shot. What is a hockey assist?

Thanks,
Conrad


Dear Conrad,

A hockey assist refers to a pass that led to a pass that led to a goal or basket. It’s called a hockey assist because hockey is the only one of the major sports to credit players for it in basic official statistics. A hockey player who passes the puck to a teammate who scores is given an assist. A hockey player who passes the puck to a teammate who passes the puck to a teammate who scores is also credited with an assist. To distinguish the two types of assists, the first one is called a primary assist and the other is called a secondary assist. What the hockey world calls a secondary assist, the rest of the world calls a “hockey assist.”

Every sport has a historical group of simple statistics which defined how casual fans and even insiders thought about players for a long time. Examining the statistics can also tell us something about the culture of the sport. In hockey, one of those basic statistics was points, calculated by adding all of that player’s goals and assists. This is perhaps simplest way to judge a player’s worth. In a player’s cumulative season or career point total, a secondary assist counts just as much as a primary one. From this, we can intuit that hockey values teamwork and spreads out credit for achievements more than most sports. This rings true considering some of hockey’s other traditions, like putting the name of every player from the championship team on the Stanley Cup, hockey’s ultimate trophy.

The hockey assist is not without its critics. In fact, a quick google search reveals people who call it a lie, pointless, and less sense than almost any other rule in sports. People need to chill out. The statistical revolution has come to every major sport and has completely revolutionized the way players are evaluated within teams. No team worth its salt is going to make player decisions on statistics as fundamental as assists or points. Furthermore, as people have become more savvy about looking for meaningful statistics in other sports, the hockey assist received some serious consideration. Here’s a great blog post by Kevin Yeung for SB Nation’s Memphis Grizzlies blog, Grizzly Bear Blues, in which he explores the hockey assist in a basketball context. It’s worth a read if you’re interested in learning more about the value of your basketball hockey assist!

Thanks for reading,
Ezra Fischer

June 8, 2015: The Anatomy of a Record Breaking Day

This blog set a personal record for views yesterday: 1,388!

I don’t normally write about Dear Sports Fan or its stats. In fact, it feels a little self-serving to do so, but in the spirit of enthusiasm and transparency, I want to invite you all to join me on the inside of this record breaking day.

1,388 is around 400 more than the previous record set on February 1, 2015, during this year’s Super Bowl. The first thing I wondered about was, “Why yesterday?” Yesterday was a good day for sports in general. The United States Women’s National Soccer Team played its first game of the 2015 World Cup, the National Hockey League’s Stanley Cup Finals had its third game of a possible seven, there were eight Major League Baseball games, and three college baseball Super Regional games, two of which went into overtime. Still, when it comes to great sports days, it’s hard to argue that yesterday was better than this past Saturday which featured the first day of the Women’s World Cup, the UEFA Champions League finals, the first game of the Stanley Cup Finals, and the Belmont Stakes which produced the first triple crown winner in horse racing since 1978. So why did Dear Sports Fan get more than twice the number of hits yesterday than it did Saturday?

One reason might be that I’ve been focused on June 8 for a long time now. I’m a big fan of the U.S. Women’s National Soccer team and I also think they are a great team for casual or non-sports fans to get behind. (Quick aside. I chose yesterday’s game to use for the first ever Dear Sports Fan Viewing Parties Meetup and it was great. If you live in the Boston area, join us!) As I wrote yesterday, if national sports teams are supposed to say something about the country they represent, then the women’s national soccer team is the most positive and most accurate representation of the United States. Over the past month, I’ve written and published profiles of all 23 of the women on the team. I had been pleased with the response as I published them and I was even more pleased yesterday to see how people used them before, during, and after the game. In total, the 23 profiles were viewed 230 times. If you’re curious about which player received the most curiosity, here are the stats:

Another reason for the great statistics might be the excitement of the Stanley Cup Finals. Game Three in a good series, which this one is, should always be more exciting than Games One and Two. Sure enough, the real work-horses of the day were not the soccer posts, they were hockey posts. Hockey was the number one sport people used Dear Sports Fan to learn about yesterday, with a whopping 594 views. The three leading posts which accounted for over 95% of the hockey views were:

All three of those posts are relatively technical questions. If filed in a Hockey 101, 201, or 301 course, each would fit in a 200 or 300 level course, definitely not 100 level. This is great news, because it suggests that either people who don’t normally watch sports are still curious about pretty technical topics or that sports fans themselves sometimes get confused and need a reminder of how things work. Or both!

If you split everything Dear Sports Fan does between “Understanding” posts meant to explain how sports work and “Following” posts which help the casual or non-fan know what’s going on in sports at the moment, 74% of the views yesterday were in the Understanding category and 22% were Following posts. I’m still looking for ways to make the Following content more useful and attractive but this is probably around the right ratio for Dear Sports Fan as it grows. If you have ideas about what you’d like to read or listen to every day, let me know.

Although it sometimes seems like sports is an all-year, all-the-time avocation, sports do have seasons. Ice hockey, basketball, and soccer will all be wrapping up in the next few weeks and football season doesn’t start until late-August/early-September. That’s a lot of my content! Summer is going to be a real fallow season unless I concentrate on writing more about baseball. Here’s the by sport breakdown from yesterday:

  • Hockey – 42.80%
  • Soccer – 26.95%
  • Baseball – 8.57%
  • Basketball – 6.56%
  • General – 3.60%
  • Volleyball – 3.39%
  • Football – 1.87%
  • Other Sports – 0.72%
  • Tennis – 0.50%

It’s amazing how low football gets in the offseason considering how it dominates my stats when it’s in season.

Perhaps my favorite lesson from yesterday is that the long tail works. A notion popularized in 2008 by author Chris Anderson in his book, The Long Tail, the idea is that technology has made it easier than ever to sell a wider array of things at smaller quantities. In the context of a blog, the long tail is hard work. Four years of work on Dear Sports Fan and almost nine months of writing around three posts every day means that I am starting to accrue a large backlog of content. During yesterday’s record setting day, these posts contributed materially to the stats, even if each one of them was only viewed a little. There were 105 posts that received five or fewer views yesterday. These posts accounted for 188 views or 14% of the total. There were 67 posts that were viewed just once yesterday! This is thrilling because it’s a clear measure of how the daily grind contributes to the whole.

Thanks so much for reading and sharing Dear Sports Fan. This is a thrilling, albeit sometimes creaky roller-coaster ride to be on, and it’s great to know that I have wonderful people on it with me!
Ezra Fischer

What are bench points in basketball?

Dear Sports Fan,

What are bench points in basketball? Sounds like they earn points for quietly sitting on the bench?

Thanks,
Amshula


Dear Amshula,

Bench scoring is a statistic that expresses the number of points scored in a basketball game by players who did not start the game. As with any statistic, the questions we want to answer to understand it are: how is it calculated, what is it meant to express, how well does it express it, and what can we learn about the sport, in this case basketball, from the statistics existence.

In basketball, as in other sports, when the game starts, only some of the players on each team are on the court. Others sit on the bench at the start of the game, prepared to play, but not playing yet. These players may be called substitutes or bench players. During the course of the game, they may play or they may not — it’s entirely up to the coach who makes his decision based on an understanding of his players’ strengths and how the game is going. Any points these substitute or bench players score will be added together to create the cumulative statistic of bench points.

Bench points is meant to express the relative strength of a team’s substitutes. This is an important thing to try to measure, even in basketball where the strength of individual players is so influential to the game’s outcome. Unfortunately bench scoring only does a moderately good job of expressing this. Part of the problem is that pure scoring is not as important as scoring more than the other team. A team’s bench may score 40 points but if they allow 60 points while they are doing it, that’s not very good. Another troubling element is that the statistic doesn’t necessarily compare apples to apples. There are no rules about how much a coach needs to play his starters or his substitutes. For some teams, the starters might play virtually the whole game. On other teams, the substitutes may play close to half the game. Comparing the bench points between a team whose starters play the whole time and a team whose starters only play a little more than half is patently unfair. Although it may seem ideal to have the best five players start each game, on some teams that is not possible or not desired. A team may have two very good players who play identical positions. Bringing one of those players off the bench might be better than trying to play two incompatible players. Some teams may tactically prefer to have their third best scoring option play as a substitute so that there’s never a time when all three of their best scorers are resting simultaneously. That’s the case with the current Boston Celtics who bring two of their best offensive players, Isaiah Thomas and Kelly Olynyk of the bench.

The existence of the bench points statistic gives us a glimpse into one of the most important debates in basketball. Is winning in basketball about having the best player or the best team? For proponents of the best player approach, bench points would be an almost meaningless statistic. Who cares which team’s sixth through tenth best players score more than the others, these folks might think, what matters is whether my top dog is better than yours. People who believe that basketball games are inevitably decided by which group of players plays better together might point to bench points as a helpful way of expressing which team is deeper and more playing more collectively.

Keep watching and questioning,
Ezra Fischer


What Does Games Back Mean in Sports Standings?

Dear Sports Fan,

What does games back mean in sports standings? And how can a team be a half game back?

Thanks,
Greg

— — —

Dear Greg,

That’s a great question! Games back can be a confusing concept. Games back is a metric that attempts to show how far behind a team is, controlled for the number of games they have played. A team can be a certain number of games back from another team or from a position in the standings. In both scenarios, the target is moving. Games back is a concept that confuses many people who follow sports religiously so showing an understanding of this concept gives you a simple way of flashing your sports expertise, even among sports fans!

On the first day of a season, Team A beats Team B. Team A’s record is now 1 win and 0 losses. Team B’s is 0 wins and 1 loss. Team B is behind Team A in number of wins and in games back. So far those are the same thing. On the second day of the season, Team A plays Team C and wins again. Team B doesn’t have a game. Now Team A’s record is 2 wins and 0 losses and Team B’s record is still 0 wins and 1 loss. Team B now has two fewer wins in the standings but they are not two games back of Team A. This is because Team B has played one fewer game and the games back metric tries to control for that. Games back controls for unplayed games by counting them as one half of a win. You may hear these unplayed games called games in hand, so just remember that while a game in hand may be worth two in the bush, it’s only worth half a game in of games back. Team B is said to be 1.5 games back from Team A.

As the season goes on, this metric becomes a little harder to calculate in our heads like we just did for Team B and Team A. Wikipedia has a simple calculation for games back and though I don’t exactly understand why it works, I believe it works. It’s Games Back = ((Team A’s wins – Team A’s losses) – (Team B’s wins – Team B’s losses))/2. In our scenario, that’s ((2-0)-(0-1)/2 which simplifies to 3/2 or 1.5 games back.

In addition to calculating how many games back Team B is from Team A, it’s also common to express games back relative to a position in the standings. Two common ones are games back (or behind or out of) first place or the last team that would qualify for the playoffs. In this case, the calculation is the same, it’s just done by comparing Team B to whatever team represents that place in the standings. If today Team A is in first place, Team B would be 1.5 games out of first place. If tomorrow Team C, D, or E[1] is in first place, the calculation would be done between their record and Team B’s record.

AL StandingsBefore we leave this topic, let’s look at some real standings as of today in Major League Baseball. The WCGB column stands for WildCard Games Back. The way baseball playoffs work is that the three division winners all make the playoffs automatically and then the next two teams with the best records make it as well. These two playoff spots for non-division winners are called Wildcards. The WCGB column is calculating the number of games back a team is from getting that second and last wildcard playoff spot.

Right now the Indians are in the last playoff spot so they are zero games back. They are the target. The Rays have played the same number of games as the Indians and have one more win and one fewer loss so they are said to be +1 games back. Don’t worry about how stupid that sounds, this means they are a game ahead. The Rangers have also played exactly the same number of games as the Indians. They have one fewer win and one more loss though, so they are 1 game behind the last playoff spot as represented currently by the Indians.

We have to go all the way down to the Mariners to find a team that is an uneven number of games back. If you add their wins and losses, you see that the Mariners have played 159 games compared to the Indians’ 158. That explains the .5 in the games back column. The Indians have 18 more wins than the Mariners but because they have a game in hand, they are given an extra .5 when calculating how far back the Mariners are compared to the Indians.

Data visualization guru Edward Tufte uses sports standings to show how much data can be packed into a simple table and remain understandable (even to dumb sports fans is the unspoken ellipses that I hear) and why making a chart for any fewer than a few hundred data points is usually not necessary. As a devotee of his, I’m happy you asked this question. Hopefully this post has made all those tables in the sports section a little easier to read!

Thanks,
Ezra Fischer

Footnotes    (↵ returns to text)

  1. GO TEAM E!!!

Which Baseball Stats are Habitual and Which Have Meaning?

Dear Sports Fan,
Which baseball stats do we track based on tradition and which really matter?
Thanks,
Pat

Dear Pat,

Thanks for the question. You have put your finger on a question that has come to dominate the conversation among baseball experts – both those who play and coach the game, and those who cover it – for the past decade or more.
More than any other sport baseball values its tradition and measures and compares eras by statistics. In today’s data driven world, however, baseball professionals have come to realize that many of the tools they have relied on are overly blunt.
Common statistics hitters were measured by, for example, included:
  • RBI: Runs Batted In – ie, I hit a ball, and as a result a runner already on base scores
  • Batting average: the percentage of times a player gets a base hit(successfully reaches base by hitting the ball where it can’t be caught/he can’t be put out)
For pitchers:
  • ERA: the number of runs a pitcher allows on average (discounting errors by the position players in the field behind him)
  • Wins: the number of times a pitcher’s team wins a game when that team maintains a lead established after the pitcher has pitched 5 2/3 innings
What we now know is that these statistics do not actually capture an individual player’s true value – in most cases, because they rely on the contributions or efforts of other players. For example, it’s difficult for a player to have a high RBI count if the players who hit before him don’t get on base – thus giving him an opportunity to drive them home.
In addition, batting average counts hits, but it discounts other contributions a batter makes – for example, getting on base by taking a walk or bunting or hitting a ball in such a way as to move a base-runner ahead, even if they themselves make an out. A pitcher could dominate an opponent and still lose a game because his teammates either do not score runs or play bad defense behind him.
As a result, baseball clubs have largely moved beyond these blunt tools and, to varying degrees of complexity, have designed metrics that directly measure how each individual player’s presence makes it more or less likely for their team to win. This phenomenon – which started in baseball and was captured most memorably in the book Moneyball – has spread to virtually every other sport.
One example of this is the Value Over Replacement Player – an advanced statistic that allows teams to compare one of their players to an an average player at the same position. I basically failed math, so I’d be hard pressed to explain in much more detail – but as far as I can tell, the people who were paying attention in algebra have magically figured out a way to calculate how many more runs a player is contributing to his team than that average player would.
Thanks,
Dean Russell Bell

How are Batting Averages Calculated?

Dear Sports Fan,

Can someone explain to me how batting averages are calculated, and what the .000 etc. means?

Thanks,
Dot Dot Dot


Dear Dot Dot Dot,

Batting averages in baseball somehow manage to be deceptively simple and deceptively complicated at the same time. We will start with the simple and then move to the complicated.

Batting averages look weird — they usually range from around .200 to .375 but don’t be fooled, it’s just a percentage expressed with one decimal point. So, the odd looking .200 is 20.0% and .375 is 37.5%.

But!

Things get more complicated when we start reasoning about what exactly the batting average percentage is made up of.

  • Batting average = the number of hits / the number of at bats
  • Hits = when the batter safely reaches first base after hitting the ball into fair territory, without the benefit of an error or a fielder’s choice
  • Fair territory = you know, between the lines from home to first and home to third which extend out to infinity
  • Error = when someone official sitting in the stands decides that a fielder has messed up in such a way that allowed the runner to advance when they normally wouldn’t
  • Fielder’s choice = When the fielder gets to catch the ball either in his glove or his hat![1]
  • At bat = every time a person comes to the plate except when he gets a walk, is hit by a pitch, hits a sacrifice, is awarded first base due to interference or obstruction, the inning ends while he is still trying to get a hit — likely due to a base runner being thrown out, or he is replaced by another hitter.
  • Walk = the opposite of “three strikes and you’re out,” this is “four balls and you’re on”
  • Hit by a pitch = hit by a pitch — you get to advance to first base if this happens
  • Sacrifice = this is by itself complicated, but basically a hit is a sacrifice if you intentionally hit the ball where you’re likely to be out, but it helps one of your teammates who is already on base, advance from first to second, second to third, or third to home.
  • Interference or obstruction = the catcher can’t tickle the batter while he is trying to bat
  • Inning ends probably due to someone getting thrown out = if someone tries to steal a base when their team already has two outs in the inning and they fail, then the inning will be over
  • Replaced by another hitter = when the coach decided this guy is not going to get it done and replaces him in the middle of an at bat[2]

Got that? Right, so this really does seem needlessly complicated. And the problem is that the complication masks something really important. Batting average is a crappy measure! Check this out. According to batting average, these players are all exactly the same over 10 at bats:

  • Player A: two home runs, one triple, seven strike-outs
  • Player B: three singles, seven strike-outs
  • Player C: three singles, three walks, four strike-outs

All three players would have a batting average of .300 but you tell me which you would want on your team! Player B is obviously worse than A or C. It’s a close match between A and C for me — A is certainly a more powerful guy, but C managed to at least get to first base six out of 10 times at the plate. That’s remarkable! Since the 1970s there has been a slow but increasingly accepted revolution against batting average and many of the other traditional statistics led by the guys at SABR — the Society For American Baseball Research. They and their intellectual descendants have sought to replace the old stats with new, more meaningful ones with really silly abbreviations like: BABIP, DIPS, OPS, VORP, WAR, and the always important LIPS.

Those are a story for another time… until then, we’ll leave you with this:

Adios,
Ezra Fischer

Footnotes    (↵ returns to text)

  1. This is not true
  2. Or like, if the batter gets injured… possibly from laughing too hard because of the catcher’s tickling.