Understand the odds – how betting on tennis works

When Americans think about betting on sports, our first thoughts usually turn to football and horse racing. Over in England and Europe, the sports to bet on are soccer and tennis. To explain how betting works in tennis, I called on Luke Rees, a British sports fan and writer. Here’s what he wrote:

When placing a bet on a tennis match, it can often be quite confusing to interpret the various odds available. There are numerous markets to pick from, and also many different options for those looking to boost their profits, meaning punters often decide to stay clear of the tennis game.

This article will outline the basics of reading the odds, and provide advice for tennis spectators who want to make the game a little bit more interesting.

Betting On the Money Line

Money line bets are the most basic and popular market in tennis (and the majority of sports for that matter, including horse racing). Essentially, the bookies provide the odds on the outright winner of a match, and you simply pick your favorite for the win. The favorite in a match is given a negative (-) money line, and the underdog is indicated with positive (+) money line.

Here’s an example:

  • Andy Murray -190 (favorite)
  • Vasek Pospisil +300 (underdog)
  • Negative money line: this indicates the amount of money needed to bet in order to win $100 in profit. So, in the example above, it would require a $190 wager on Andy Murray to win $100 in profit, for a total pay-out of $290.
  • Positive money line: this indicates the amount of money that would be won from a $100 wager. In the example above, a $100 bet on Vasek Pospisil would result in a $300 profit if he wins the match, for a total pay-out of $400.

The first step to take when making a bet is to look at the money line and decide if it is worth taking out a bet. For instance, you may decide that betting on Pospisil is not worth it at 4/1 odds ($400 return for $100 bet) because Murray is currently the strong favorite. But say the money line on Pospisil was 8/1 or +800: you might have a different opinion if you stood to make a $900 return.

The money line is used not only for individual games, but also for betting on a player to win the tournament outright. This is commonly referred to as Outright Winner betting: you can see some Wimbledon outright winner predictions at Bookmakers, for example.

Betting ‘Each Way’ means you place two bets, one on the player to win the tournament and one on them to finish in the top 2 places (i.e. to reach the final).

The Handicap Market

The handicap (or HCAP) market is another popular market. This is because rather than predicting the outright winner, you are instead betting on how a certain player performs. A handicap market simply means that one of the players is given an advantage at the beginning – usually by adding a certain amount of games to their overall score.

Let’s take the same tennis example. This is how it might look:

Andy Murray -7.5 -190 vs. Pospisil +7.5 -190

The money line is even on this bet, what has changes is the handicap. In both cases, a wager of $190 would bring back a $100 win if the right player is chosen. The pay-out is even, because the spread has balanced out the competition between the two players.

Imagine that this is the result from the match: 6-3 6-4 6-4

Totals Games Won – Murray 18 vs. Pospisil 11

As you can see, despite losing the match in straight sets, a bet on Pospisil would have actually been the winner in this case. The handicap of +7.5 games for Pospisil gets added to his 11 games won to give him 18.5 total. That is a half-game ahead of Murray in this case, and so a bet on Pospisil would be paid out.

Betting on Accumulators

One final interesting way to bet – if you’re feeling especially confident and want to boost your profits throughout a tournament – is to place multiple bets on a series of matches. These are known as Doubles, Trebles, and Accumulators. For the bet to come through, you have to get each result correct, otherwise there is no pay-out.

Imagine a $30 single bet on Novak Djokovic to beat Andy Murray at odds of -250 (or 2/5) returns just a $10 profit. This may not be particularly appealing, so to make it more worthwhile you could put down a treble on three different games. If all of them pay out around -250, your $25 stake will make you $50 profit. After each correctly predicted match outcome, your profits go up exponentially.

With the tennis season well underway, and the U.S Open just around the corner, now’s the time to get down to the bookies with your new betting know-how. But always remember, never bet what you can’t afford!

Luke Rees is a sports writer and enthusiast from London, UK, who likes to cover tennis, cycling, and football (or soccer to y’all). His most memorable sports experience was watching Federer and Roddick in the Wimbledon final in 2009 – he was rooting for Roddick, but Federer absolutely smashed it!

Why is 50% written .500 and said "five hundred" in sports?

Dear Sports Fan,

Here’s something I don’t get about sports. Why is 50% called “500” in sports? Is this some kind of metric system thing? Or is it for a purpose?

Thanks,
Emily


Dear Emily,

There are a variety of numbers in sports that are expressed as a number between zero and 1,000 when they more naturally might be thought of as a percentage. For example, a team that has won half its games and lost half its games is often said to be a “500 team” or playing “500 ball.” What this means is that they have won 50% of the games they’ve played. Likewise, a basketball player who scores on 38.9% of the three point shots she attempts may be said to be “shooting 389 from downtown.”

There’s nothing magical about these numbers, they’re just like percentages — a way of expressing the result from one number being divided by another. In the case of percentages, we take one number, divide it by another number, and then multiply the result by 100 and smack a percentage sign next to it. Thus one divided by two, which is .5 becomes 50%. The difference between a percentage and a sports number is that instead of multiplying by 100, sports numbers get multiplied by 1,000. At least when spoken out loud. A lot of times when you see a sports number like this written out, it will actually be written as “.500” even though no one would ever read it as “five tenths” instead of “five hundred” in a sports context.

If you always want to express a ratio to the hundredths place, it kind of makes sense to multiply by 1,000 instead of 100. It’s certainly easier to refer to something that happens three times every eight times it’s attempted as “three seventy five” than “point three seventy five” or even “thirty seven point five percent.” It’s not surprising that sports people feel that their numbers need this level of accuracy. People who live in and around sports often seem to be obsessed with accuracy to the point of over-precision. For example, players eligibly to be picked in the NBA draft tonight have their height measured down to the quarter inch with and without shoes! Commentators in many sports will often argue about whether it looks like something a player did took .25 seconds or .28 seconds. As if the commentators can actually judge a hundredth of a second difference from their perch at the top of the stadium! Because the difference between winning and losing in sports can sometimes be as slim as a fraction of an inch or a hundredth of a second it’s tempting to believe that all metrics in sports need to have that level of detail.


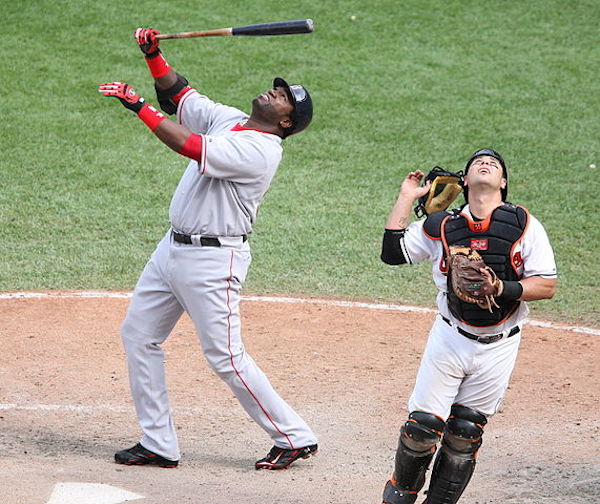
In defense of the sports way of expressing percentages, its historic source is a number that reasonably should be expressed to the tenth of a percent: batting average in baseball. Batting average is a player or team’s number of hits divided by their number of at bats. It’s not the best metric in baseball, in fact it’s a reasonably misleading one, but it does have a very long history. For many years, it was considered a key statistic in measuring how good a player was doing against to his current competition and for making historical comparisons. Baseball is obsessed with statistics because it creates them so nicely. Its long, 162 game season virtually guarantees that any measure one can imagine will have a statistically significant sample over the course of a year. With 30 teams and well over a dozen position players on each team, not even to mention the 120+ history of professional baseball, if you really want to know how a player’s batting average compares to his peers, you do need to take that number to the third decimal point. It would be far less interesting to say that Manny Machado and Adrian Gonzalez have the same batting average of 30% than to say that Machado is 18th in the league, with a .304 (pronounced “three oh four”) batting average and Gonzalez is 30th with a .296. Eight tenths of a percent may not seem like much, but over the course of a season (162 games times roughly 3.5 at bats per game) that’s a difference of four or five hits.


Of course, the source of the habit doesn’t matter so much if it is misapplied. Team records are the clearest form of misapplication. The problem with using this kind of number to express a team’s record is that aside from the most obvious numbers like .333, .666, and any of .000, .100, .200, and so on, these figures are very hard for us to translate into numbers in our heads. Quick — tell me how many wins and losses a team whose record is .527 has. According to the current MLB baseball standings, the answer is 39 wins and 35 losses, like the Toronto Blue Jays have. Although these numbers are convenient for creating a standings table (because they allow an easy comparison of teams who have played different numbers of games) they probably should not be displayed. In terms of figuring out how well your team is doing, the order of the teams in the standings and the games back metric are far, far better.

Regardless of how reasonable or unreasonable the sports percentage expression is, it’s deeply engrained in sports culture and seems to be here to stay. It’s easy to wonder though, if this small form of numerical manipulation makes it easier for sports people to mangle numbers in much sillier ways, like the habit of asking players to “give 110%.” That’s a story for another day.

Thanks for your question,
Ezra

Is there really not enough parity in women's soccer?

One of the common criticisms of women’s soccer, once you get by all of the more virulently idiotic bigoted nonsense, is that women’s soccer tournaments, like the World Cup, aren’t as exciting as men’s tournaments because there isn’t enough parity. This criticism contends that the strong teams are too strong and too few and the rest of the teams are too weak. As a result, the World Cup or Olympics are long periods of boring cake-walks of the great teams over the poor with only a few games of evenly matched soccer in the semifinals and finals. It’s unclear whether people who subscribe to this line of thought believe that an ideal tournament would be made up of completely even teams or if they believe in some ideal distribution of skill.

No matter, what I was curious about and what I wanted to see was how the frequently criticized women’s World Cup would compare to the men’s edition of the tournament. To do that, I took data from the Group Stage of this year’s women’s World Cup and the 1982 men’s World Cup held in Spain. Why 1982? Aside from it being my birth year, like this year’s women’s tournament, 1982 was the first time the men’s field expanded from 16 teams to 24. Like in Canada this year, the expansion in 1982 opened the World Cup to a number of countries who had never made the field before.

New countries:

  • 1982 men’s World Cup – Algeria, Cameroon, Honduras, Kuwait and New Zealand
  • 2015 women’s World Cup – Cameroon, Costa Rica, Ecuador, Ivory Coast, Netherlands, Spain, Switzerland, Thailand

This difference can be attributed to the much longer history of men’s World Cups before expanding to 24. The men’s World Cup began in 1930 and was held 11 times while it grew from 13 to 24. The women’s World Cup was first held in 1991 with a field of 12 and took only six tournaments to expand to 24 teams.

In order to determine parity, I took the scores of the Group stage games and analyzed them. If women’s soccer is truly evolving in a less competitive (and therefore exciting) way, we’d expect there to be more blow-outs and fewer closely fought matches. We’d expect to see more games like Germany’s 10-0 beat-down of Thailand in 2015 than we would Hungary’s 10-1 beat-down of El Salvador in 1982. The first way I broke out the games was by goal differential — 0 if the two teams tied, 1 if the winning team scored one goal more than the losing team, regardless if that was a 1-0 win, a 2-1 win, or a 11-10 win (there are none of those in soccer.)

1982 men’s World Cup goal differential

  • 0 – 12 games – 33%
  • 1 – 11 games – 31%
  • 2 – 4 games – 11%
  • 3 – 6 games – 17%
  • >3 – 3 games – 8%

2015 women’s World Cup goal differential

  • 0 – 10 games – 28%
  • 1 – 15 games – 42%
  • 2 – 3 games – 8%
  • 3 – 0 games – 0%
  • >3 – 8 games – 22%

How you read these numbers depends entirely on how you perceive two goal and three goal games. If you think a 2-0 game or a 3-0 game is a blow-out and not exciting, then you’d conclude that the women’s game is more exciting in 2015 than the men’s game was in 1982. A full 70% of all the group games in 2015 were decided by less than two goals, while only 64% were that close in 1982. If, however, you think that anything less than a four goal difference is representative of a pretty even matchup, you’d conclude that there are almost three times more blow-outs in the women’s 2015 World Cup than in the men’s 1982 World Cup. As with almost anything, you can interpret the data how you want. I would argue that a three goal differential is enormous in soccer and unlikely to occur between teams of close to even strength. As such, my conclusion is that, while there are a few more severely lopsided games in 2015 women’s competition than there were in men’s competition in 1982, there are also more very close games in 2015 than in 1982.

Another way to look at the same data is to focus not on goal differential but on the most common soccer scores: 0-0, 1-0, 1-1, 2-1, and 2-0. When I looked at the data that way, I discovered that exactly the same percent of the games in both tournaments fell within that range – 66%. There was some variety within those scores but not enough to seem meaningful in any way.

Overall, the 2015 Group Stage games were a little bit more high scoring (107 goals compared to 100) and although there were a few more closely competitive games, there were also a few more wild blow-outs which led to a higher average goal differential (1.75 in 2015 compared to 1.5 in 1982.) Frankly, it’s quite surprising how similar the numbers are across gender and generations. The women’s game in 2015 is not as evenly matched as the men’s game in 2015 is but it’s basically exactly where the men’s game was in 1982 when its World Cup expanded to 24 teams and the women’s game has arrived at this point much faster.

All the data I got for this post was taken from the Wikipedia entries for the 1982 men’s World Cup and 2015 women’s World Cup. You can view or copy the data here. Please give attribution if you use it.

Why isn't a shot that hits the post a shot in hockey?

Dear Sports Fan,

Over the past three years, I’ve become an ice hockey fan but there’s one thing that still really annoys me. Hockey fans and commentators often talk about “shots” as a meaningful statistic but it seems totally meaningless to me. Apparently a shot that hits the post doesn’t count as a shot — just the same as a shot that goes twenty feet wide. That distinction should mean something! What does the shot statistic means and why I should care about it?

Thanks,
Sonja


Dear Sonja,

Sports are full of statistics. From the outside looking in, it might seem like sports fans are just obsessed with statistics for no reason. That’s probably true for some sports fans but the purpose of a stat, the reason why it exists, is to represent some aspect of the game numerically so that it’s easier to know how well a team or player is doing. Stats are supposed to help the viewer understand what’s going on in a given game and to compare the performance of their favorite teams and players not only against their opponents but also against their own past performances. The sports world is in the midst of a thirty year statistical revolution during which many of the older statistics have been torn down and either replaced by new ones or simply discredited. Shots are one of ice hockey’s oldest statistic. Why don’t we examine what the shots statistic is, what it’s trying to tell us, and what some potential replacements could be.

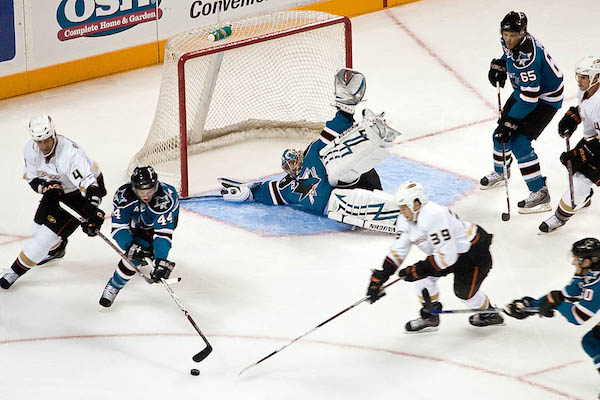
The full name of the statistic which is commonly referred to as “shots” is “shots on goal.” In some ways, this helps explain what the statistic means and in other ways… well, in other ways, it probably serves only to further the confusion. “Shots” sounds like it should include any time a player winds up and shoots the puck, intending to score a goal, even if her shot is blocked or goes three feet wide. When you use the full name of the statistic, it becomes more understandable why shots that are blocked or miss the goal aren’t counted. That’s good — a stat’s name should reflect what it actually is. What you point out about hitting the posts or the crossbar is true though. Those shots are not counted in the shots on goal statistic even though they may feel like they should.

My totally unfounded guess about how this game about is that goalie statistics are a little bit older than skater statistics. Perhaps the shots statistic was created in response to an older goalie statistic. Saves — the number of times a goalie catches or deflects the puck away — makes sense. Want to know how active a goalie has been during a game? How many saves did he make? Shots seems like the reverse of saves plus the number of goals a team scores. Every time the goalie makes a save the opposing team registers a shot. Every time the goalie doesn’t make a save and a goal results, the other team registers a shot. Combining metrics like these would make the life of an early statistics keeper much easier. A shot that hit the post and didn’t go in is clearly not a save, so it didn’t get counted as a shot either.

The problem with the shots on goal statistic, which I think you are getting at by objecting to the way shots that hit the post are treated, is that it doesn’t do a very good job at telling us anything meaningful about the game. At first glance, it seems like it’s trying to show how well a team or player is doing on offense. Alas, it doesn’t distinguish between a puck that hit the crossbar and one that missed by six feet, even if those two acts are very different from a successful-offense perspective. It counts a harmless, non-threatening long-distance wrist shot but it doesn’t count a puck that nearly goes in before being blocked by a desperate defender. If a team wanted to inflate their shots statistic, they would just wildly throw the puck at the net every time they got near the offensive zone. That’s not a good offensive strategy for winning, so it seems like an offensive statistic shouldn’t encourage it.

Before we get to ideas for replacing this statistic, it’s worth mentioning that in real life, over a large sample size, which the 82 game regular season in the NHL is, shots is not a terrible statistic. Oh sure, in any given game it could be problematic for the reasons we just mentioned, but over time the better offensive players and teams do tend to generate more shots. This past year, the team with the most shots per game during the regular season was the Chicago Blackhawks, now playing in the Stanley Cup Finals, and the player with the most shots was Alexander Ovechkin, who also had by far the most goals. Shots don’t have to be a perfect statistic to be useful in part because no reasonable player or team actually modifies their behavior based on the shots statistic. It’s not perfect but I am still happier when the team I’m rooting for has more shots than the other team does.

One of the reasons players and teams don’t optimize for shots is because they probably don’t even use that statistic anymore. Although it’s still a mainstay of television production and newspaper columns, almost every team has its own group of statisticians who work for it. These folks create and keep much more meaningful proprietary statistics that they hope will give their team an edge over the competition. I have no idea what their statistics are but here are some other stats could replace or augment the shots statistic. In addition to shots on goal, you’ll sometimes see a “shots attempted” statistic. This counts any shot that misses or is blocked as well as ones that count as shots. That’s good because it’s basically not subjective and it’s process driven instead of outcome driven. A team that has the puck more and is playing better offensively will generate more shots, even if the majority of them miss or get blocked. Another stat that I like is “scoring chances.” This one is totally subjective. It counts any time a team looks like it legitimately might score, even if that moment doesn’t result in a shot. Virtually every time the puck hits the post, it would count as a scoring chance because if it had been an inch to the right or left, you’d have had a goal. Sometimes a scoring chance could happen without even an attempted shot. If a player is wide open in front of the net and whiffs on a pass to her and never makes contact with the puck, it’s still a glorious and missed scoring chance. The problem with scoring chances is that what you or I might think of as a legitimate chance, someone else who has more confidence in the goalie might consider a routine save and not count.

Statistics create a representational model of the sports they seek to quantify. Like drawing a stick figure, a statistic doesn’t need to be perfect, or even good, to be helpful. The shots on goal statistic isn’t a very good one, but when combined with others, it can give a general sense of how a game is going.

Thanks for reading,
Ezra Fischer

Why do some numbers in soccer refer to positions? What do they mean?

Dear Sports Fan,

Why do some numbers in soccer refer to positions? What do they mean?

Thanks,
Susan


Dear Susan,

Numbers are often used in soccer to refer to a player’s position. The use of a number system to refer to positions is not unusual in sports. In American football, the NFL regulates jersey numbers so that each position has a set of numbers only its players are eligible to wear. It’s typical in basketball to refer to a player’s position by number but at least there, there are only five positions to keep track of and a player’s jersey number virtually never matches his position as it sometimes does in soccer. The use of numbers in soccer is legitimately confusing for a few reasons. First, there are 11 players on the field for each team and remembering 11 positions by number is difficult. Second, there was once an assumption that a player would wear the number of the position he played but that’s no longer the case. Third, the meaning of the numbers has evolved over time in twisted ways so that they can no longer be said to be intuitive. Luckily, only a few positions are commonly referred to by number and they are quite easy to learn. We’ll run through the history first and then get to the modern meanings.

Having players wear numbers on the back of their jerseys is actually a relatively modern phenomenon. It began in the 1920s in England with the club team Chelsea. Instead of giving their players a choice, the team assigned numbers by position. Of the 11 players on the field, they started with the most defensive player, the goalie, and counted upwards from one to 11, going from right to left when players were on the same line. Unfortunately for modern soccer viewers, the teams of the 1920s played a very different formation from ones that are common today. Chelsea played with two defenders, three midfielders, and a whopping five forwards. Today, teams play in more defensive formations with four defenders and either three midfielders and three forwards or four midfielders and two forwards. As you might imagine, this has magnificently jumbled the numbering. The shift in formation is only one of the evolutionary forces that make soccer numbers difficult to follow. Soon after they began using numbers, Chelsea took a trip to South America, where according to Wikipedia, they were called “Los Numerados” or “the numbered.” The South American host teams picked up the concept of numbering their players from back to front but, since they played with different formations, they used almost entirely different number to position pairings.

For a while, this must have been so confusing to international viewers as to make the numbers virtually useless in decoding the game. Over time though, as formations have continued to evolve and soccer has become an even more globally blended game, with players from all over playing everywhere, the differing number systems have coalesced into something of a consensus. Simultaneously, players became more empowered in terms of choosing their jersey number. Although they were in the past, today’s players are no longer required to wear the number of their position. What we’re left with is the use of some numbers to refer to positions despite the fact that their meanings are almost totally divorced from jersey numbers. Here are a few of the most important numbers to know:

  • 9 — A nine is the central attacker on any team. Whether she uses speed to streak towards the goal and score or strength to receive long passes and hold on to the ball while his teammates move up the field, the nine is the focal point of the offense.
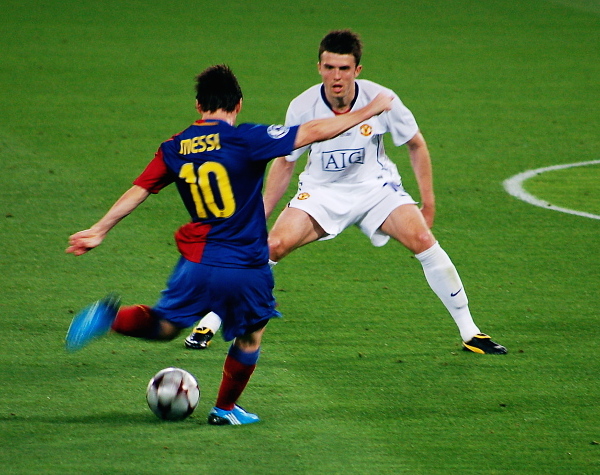
  • 10 — The ten is the best playmaker on the team. The offense flows through her on its way up the field. He is often the best known player, the most well respected player, the highest paid player, and the team captain as well.
  • 6 — A six is a holding or defensive midfielder. Like a nine, a player can be a six in different ways. A six may be a big, strong, tough player who acts as an additional defender, following the opposition’s best midfield player and tackling them hard. A six may also be a playmaker, like a ten, but farther back, helping the team transition from defense to offense.

Those are by far the most common positions you’ll hear called out by number. Here are a few others you could learn if you really want to impress people:

  • 8 — An eight is an all-purpose central midfielder. Without the offensive playmaking talents of a ten or the defensive mindset of a six, the eight does a little bit of everything. An eight is often one of the hardest working players on the field, since they have equal responsibility for offense and defense.
  • 7 and 11 — The seven or eleven are secondary scorers. If a team plays with three attackers, the seven refers to the forward on the right, the nine to the central forward, and the 11 to the attacker on the left. On teams that play with only two attackers, either the seven or the 11 may be an outside midfielder with an attacking mindset.
  • 3 — Time to give the defenders some. Defense is by far the most confusingly numbered area (remember the original Chelsea team only played with two of them) but the three is always used to refer to the strongest central defender. A great central defender is big, tough, and indefatigable.

In putting together these definitions, I leaned heavily on this article by Buzz Carrick in the Dallas Morning News. I highly recommend reading it.

Now that you know the meanings given to these numbers, go out and use them in a soccer context. You’ll get some knowing looks from the soccer fans in your life. And if anyone tries to drop a number we haven’t covered, like four or five, just ask them, “Do you mean a South American four or an European one?” That’ll stop them in their tracks!

Thanks for reading,
Ezra Fischer